 Boring Log Viewer
Reading the log
A tour of the drawing: what each part shows and where its information comes from in the data.
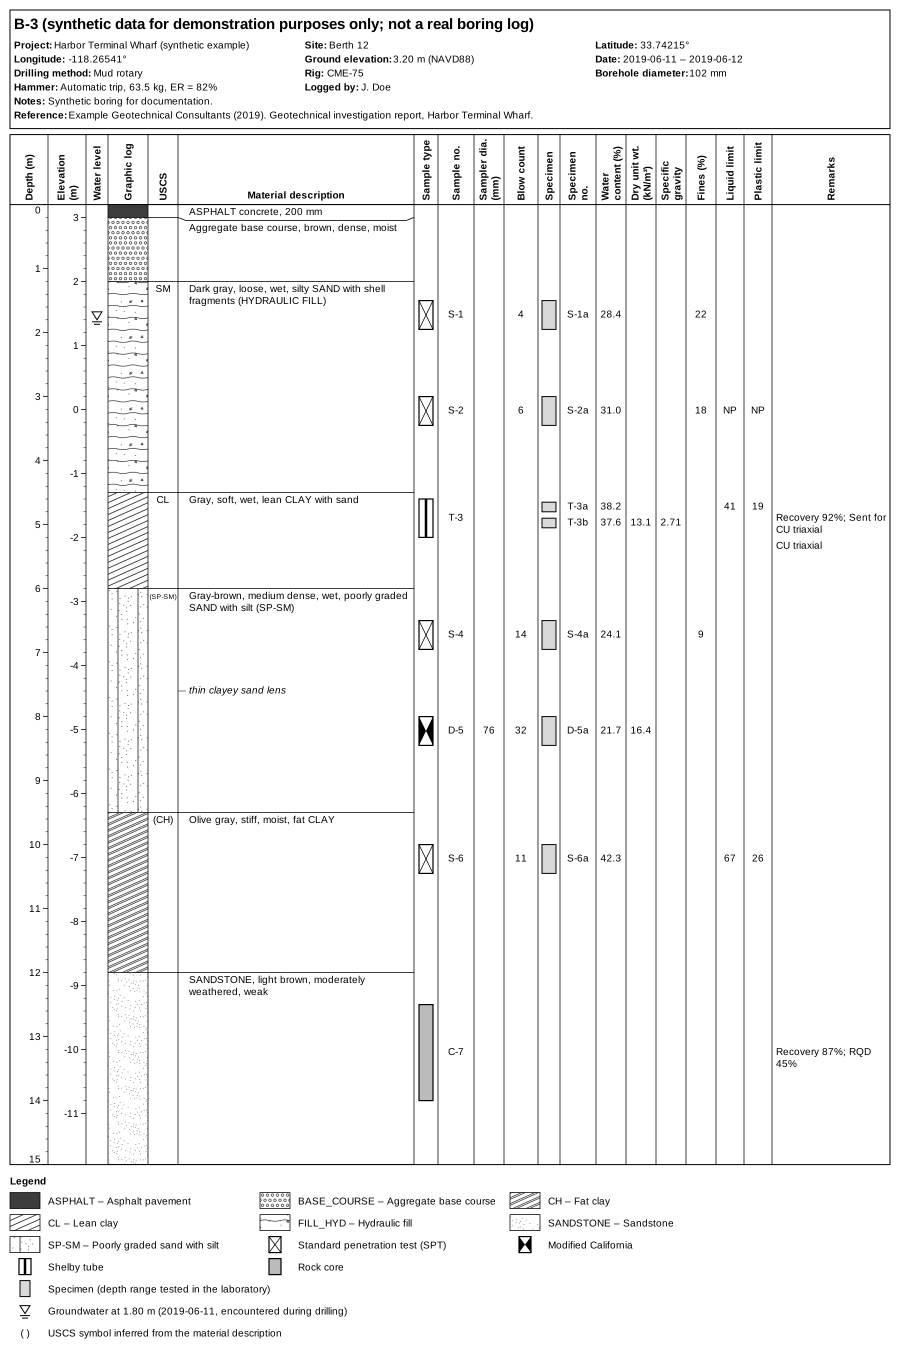
full-example.json. Click to open full size.Header
The box at the top lists the boring's metadata: project, site, latitude and longitude, ground elevation and datum, dates, drilling method, rig, borehole diameter, hammer (with its energy ratio as "ER = 82%"), who logged it, and notes. Only the items you give appear. The title is the boring_name.
Below the metadata, the references list where the data came from, such as the report a boring was taken from. They're in the header so a reader sees them before scrolling down a tall log. In an SVG, a reference's web address is a clickable link.
Columns, left to right
| Column | Shows | Drawn when |
|---|---|---|
| Depth | Depth below the ground surface, with tick marks | Always |
| Elevation | Elevation (ground elevation minus depth) | metadata.elevation is given |
| Water level | ▽ at each groundwater reading | There is groundwater |
| Graphic log | The soil or rock symbol of each layer | Always |
| USCS | The layer's USCS group symbol. In parentheses if it was read from the description; a recorded symbol that the description contradicts is shown with the description's symbol below it, in parentheses | Any layer has a symbol |
| Material description | Each layer's description, and depth notes in italics | Always |
| Sample type | The sampler symbol, drawn over the sample's depth interval | There are samples |
| Sample no. | The sample name | Any sample has one |
| Sampler dia. | Sampler outside diameter | Any sample has one |
| Blow count | The blow count as reported (e.g. 14, or 50/5in), or the blows per increment joined with dashes (3-4-4) | Any sample has one |
| Specimen | A grey box over each laboratory specimen's depth range | Any specimen has a depth |
| Specimen no. | The specimen name | Any specimen has one |
| Water content, Total unit wt., Dry unit wt., Specific gravity, Fines, Liquid limit, Plastic limit | Laboratory results, one row per specimen, level with it. "NP" in the limit columns for a non-plastic specimen. Unit weights given for a whole sample are level with the sample | Any specimen has one |
| Lab USCS | The USCS symbol from a specimen's laboratory classification (its uscs), level with the specimen | Any specimen has one |
| Remarks | Each sample's recovery ("Recovery 90%" or "No recovery") and remarks, level with the sample; each specimen's remarks, level with the specimen | Any sample or specimen has one |
You can change which columns appear, their order, widths and headings, and add your own columns (a pocket penetrometer reading, undrained strength, or a blank column for notes). See Columns and layout.
Graphic log and USCS column
Each layer is filled with a symbol for its soil or rock type. The viewer picks it in this order:
- the
hatchyou give for the layer, if any; - a material named in the description, such as fill, asphalt, topsoil or a rock name;
- the
uscssymbol you give; - a USCS symbol worked out from the description.
A layer with none of these is left blank.
A dual symbol such as SP-SM is drawn as one combined symbol. The full rules, and pictures of all the symbols, are in Graphic log and soil symbols.
Material descriptions
Each description starts at the top of its layer. When a layer is too thin for its description, the text runs on below it, and the next description starts lower down, with a leader line from the layer boundary to the text. In the example, the thin asphalt layer needs a leader: the base course description starts below its boundary.
Depth notes (observations at a single depth, such as "thin clayey sand lens" at 7.6 m) follow the layer's description in italics, with a short tick at their depth.
Why the depth scale stretches
With Fit text on (the default), the viewer makes the log taller when it needs to, so that:
- each sample's (and specimen's) row of values lines up with its symbol without running into the next row, and
- all the descriptions finish within the depth of the boring.
The scale is always uniform: one foot is the same height everywhere on the log. Stretching stops when the log body reaches 8,000 px; beyond that, rows that would collide are moved down a little instead. Turn off Fit text and set a fixed scale to keep the depth scale where you put it. See Display options.
Sample and specimen rows
The first line of each sample's values is level with the middle of its sampler symbol. A long remark wraps onto more lines below that. Specimen rows (the laboratory results) are laid out the same way, each level with its own specimen box, so a sample with three specimens has three rows of results.
Legend
The legend lists only what appears in this log: each graphic log symbol with its code and name, each sampler symbol, the specimen box, each groundwater reading with its date and note (the only place the date and note appear), and, if any USCS symbol was read from a description, a line explaining the parentheses.
Text and fonts
The log uses Arial (or the identical-width Liberation Sans or Arimo). Line breaks are worked out from a built-in table of character widths, so a log looks the same in every browser, in a PNG made by the server, and on another computer.